This episode is brought to you by the letter p
What does the p-value actually mean?
Today, I was going to talk about the effects of multiple significance testing, but then I realized that to do that, you would need to understand what the p-value means, and that I haven’t actually written about that in this blog yet. So, one step back before we take 2 steps forward, shall we?
Most researchers bow down to the almighty p-value. The p-value, for them and most casual science readers, is the number that tells them whether one result is different from another result (usually either between two comparison groups, or as a pre-post measurement). Most researchers use 0.05 as the critical level by which they define “significant” against “non-significant”. A p-value less than 0.05 is considered “significant” and above 0.05, “not significant”. This is different from “important” and “not important”, which I have discussed (perhaps prematurely) before.
To understand why multiple testing is inappropriate, you have to understand what the p-value is. Again, most researchers, and most casual science readers tend to use the incorrect definition that the p-value represents, “the probability that the null hypothesis is true.” However, this is a massive simplification of what the p-value actually represents.
To illustrate the p-value, I fall back onto the classic coin-toss.
From elementary school (and barring high improbable events like landing on the side), we know that the probability of flipping a heads on a fair coin is 0.5, and the probability of flipping a tails on a fair coin is 0.5. No big mental energy spent there.
If we were to put money (because the root of statistics is gambling–really, it’s true!) on how many heads would be flipped in 60 coin tosses, you’d be pretty safe to bet 30 heads, or somewhere around that number. Still no big mental energy spent there.
If 31 heads, or 29 heads were actually flipped in the gamble, and you had bet 30 heads, you would probably shrug your shoulders and disappointingly hand over your money.
And at 33 heads, or 27 heads you might still do the same thing.
But at some point, the number of heads (either higher or lower than 30) would make you wonder if the coin was rigged (assuming a fair flipper), and if anything beyond your range of “fairness belief” was actually flipped, you might not walk away from the table, a poorer soul, without some sort of fight.
Take out a piece of paper. Write down what that number would be for you. Above what number of heads and below what number of heads would you start a fight to get your money back?
Got it? Good.
If someone actually went and flipped a fair coin 60 times, and then did this thousands of times, you would end up with a graph that looks suspiciously like this:
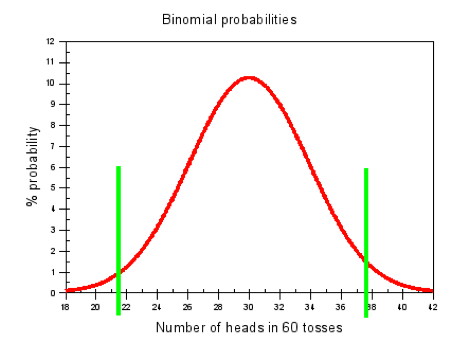 The x-axis represents the number of times heads are flipped out of 60. The y-axis represents the number of times that particular number of heads came up as a proportion of the total number of experiments.
The green lines represent the number of heads below (on the left hand side) or above (on the right hand side) which there is a 0.025 probability of attaining a result more extreme (i.e. there is a probability of 0.025 of flipping 22 heads or less, and there is a probability of 0.025 of flipping 37 heads or more).
Statistically, if we were to use 0.05 as our p-value cut-off (or alpha level), we would say that the coin wasn’t fair if someone managed to flip less than 22 heads or greater than 37 heads, because the probability of that happening is so low if the coin is fair.
However, you can only make the statement, “There is a probability of 0.05 of flipping either less than 22 heads or more than 37 heads,” if the coin is fair to begin with! If the coin was ACTUALLY weighted, the curve would look totally different!
The coin has to be fair.
The interpretation of the p-value therefore, is the probability of observing the result obtained in the study under the condition that the null hypothesis is true (i.e. the coin is fair; i.e. there is nothing special going on; i.e. in the real world, there is no difference between the groups). If that probability is very low (less than 0.05, or 5%), then we make the inference that the results must be because there IS something special going on (e.g. the supplement does in fact, do something above and beyond a placebo effect.)
Now, what number did you write down?
If your numbers were more extreme than 22 and 37, then the 0.05 cut-off, in this scenario, isn’t good enough for you. If your numbers were less extreme than 22 and 37, then you might be prepared to accept a p-value that is greater than 0.05 as a cut-off.
“But Bryan,” you exclaim, “it IS POSSIBLE to flip less than 22 heads or greater than 37 heads with a completely fair coin!”
Yes, young grasshopper, it is, but that is a topic for another day.